


Risk Heat Maps.
Risk Heat Maps — Detailed Explanation
1. Meaning and Concept
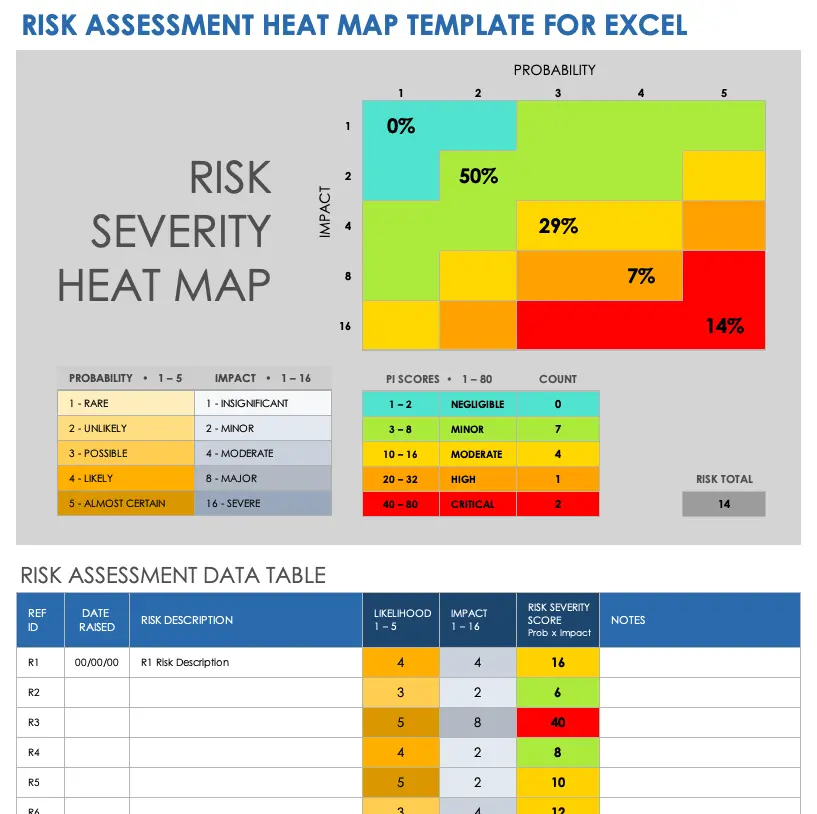
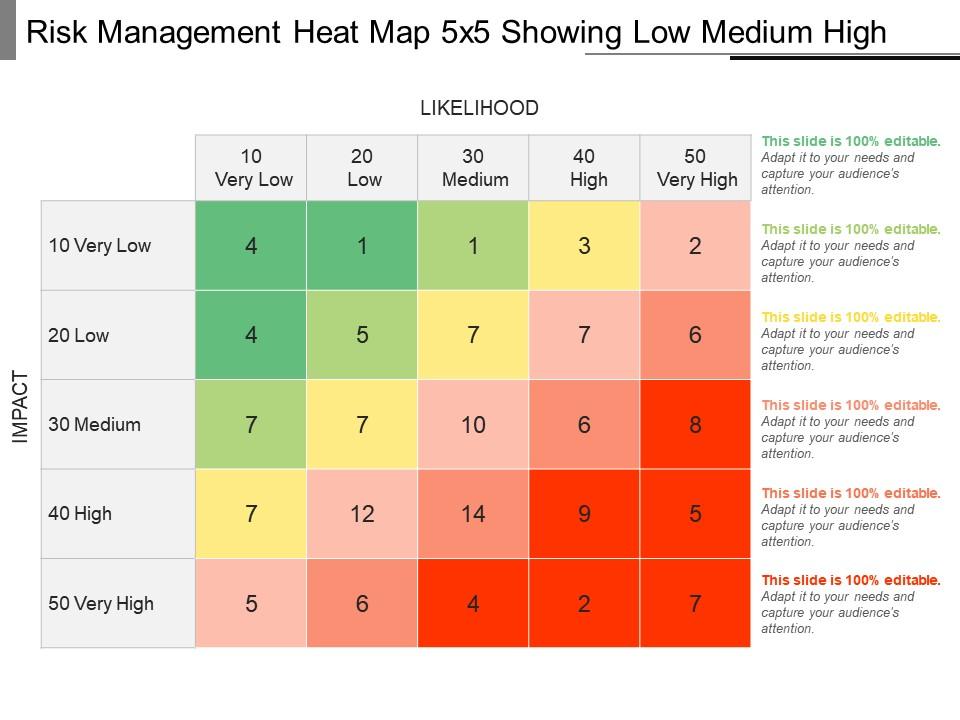
A risk heat map is a visual risk management tool used to identify, assess, and prioritize risks based on two key dimensions:
- Likelihood (Probability of occurrence)
- Impact (Severity of consequences)
It is typically represented as a color-coded matrix, helping organizations quickly understand which risks require urgent attention.
2. Structure of a Risk Heat Map
4
A standard heat map consists of:
(A) Axes
- X-axis → Likelihood (Low to High)
- Y-axis → Impact (Low to High)
(B) Color Coding
- 🟢 Green → Low risk
- 🟡 Yellow → Moderate risk
- 🔴 Red → High / Critical risk
(C) Risk Plotting
Each identified risk is placed within the grid based on its evaluated score.
3. Purpose and Objectives
- Risk Prioritization
Focuses attention on high-impact, high-probability risks - Decision Support
Assists management in allocating resources - Communication Tool
Simplifies complex risk data for boards and stakeholders - Compliance and Governance
Supports regulatory expectations for structured risk assessment
4. Types of Risk Heat Maps
(A) Qualitative Heat Maps
- Based on subjective judgment (e.g., “high”, “medium”, “low”)
- Common in early-stage risk assessments
(B) Quantitative Heat Maps
- Use numerical scoring (e.g., probability = 0.7, impact = ₹10 crore loss)
(C) Residual Risk Heat Maps
- Show risk levels after mitigation measures
(D) Inherent Risk Heat Maps
- Show risk levels before controls
5. Steps in Creating a Risk Heat Map
- Risk Identification
List all potential risks (financial, operational, legal, etc.) - Risk Assessment
Evaluate likelihood and impact - Scoring System Development
Define scales (e.g., 1–5 for both axes) - Plotting Risks
Place risks on the matrix - Risk Response Planning
- Avoid
- Mitigate
- Transfer
- Accept
- Monitoring and Updating
Continuous revision based on changing conditions
6. Legal and Governance Significance
Risk heat maps are central to:
- Enterprise Risk Management (ERM) frameworks
- Board oversight duties
- Internal control systems
Failure to maintain effective risk assessment tools may lead to:
- Breach of fiduciary duties
- Regulatory penalties
- Corporate governance failures
7. Judicial Perspective — Key Case Laws
Courts often assess whether companies had adequate systems to identify and monitor risks, where tools like heat maps are expected.
(1) In re Caremark International Inc. Derivative Litigation (1996)
- Established duty of directors to implement information and reporting systems
- Risk heat maps can form part of such systems
(2) Stone v Ritter (2006)
- Reinforced that failure to monitor risks constitutes breach of fiduciary duty
- Implies need for structured risk visualization tools
(3) Marchand v Barnhill (2019)
- Liability arose due to failure to monitor critical operational risks
- Absence of proper risk prioritization mechanisms (like heat maps) was significant
(4) Re Citigroup Inc. Shareholder Derivative Litigation (2009)
- Recognized the importance of risk monitoring systems in financial institutions
- Heat maps are typical tools in such frameworks
(5) ASIC v Healey (2011) (Centro case)
- Directors liable for failing to identify financial risks properly
- Demonstrates need for clear risk assessment frameworks
(6) ASIC v Cassimatis (No 8) (2016)
- Directors exposed company to risks beyond acceptable levels
- Highlights failure in risk evaluation and visualization
(7) Hughes-Holland v BPE Solicitors (2017)
- Clarified allocation of risk in advisory relationships
- Emphasizes importance of clearly understanding risk exposure
8. Advantages
- Visual clarity and simplicity
- Helps non-experts understand risks
- Facilitates quick decision-making
- Supports regulatory compliance
9. Limitations
- Oversimplification
Complex risks reduced to simple categories - Subjectivity
Qualitative scoring may be biased - Static Nature
May not reflect real-time changes - False Sense of Security
Over-reliance can ignore emerging risks
10. Practical Example
| Risk | Likelihood | Impact | Position |
|---|---|---|---|
| Cyberattack | High | High | 🔴 Critical |
| Supply Chain Delay | Medium | Medium | 🟡 Moderate |
| Minor Compliance Error | Low | Low | 🟢 Low |
11. Best Practices
- Use data-driven scoring where possible
- Regularly update the heat map
- Integrate with risk appetite and tolerance frameworks
- Combine with other tools (scenario analysis, stress testing)
12. Conclusion
Risk heat maps are an essential tool in modern corporate governance, enabling organizations to visualize, prioritize, and manage risks effectively. While not legally mandated in all jurisdictions, courts increasingly expect companies to maintain structured risk assessment systems. When used properly, heat maps enhance transparency, accountability, and strategic risk management, but they must be complemented with deeper analytical tools to avoid oversimplification.
RELATED Blog

comments